 |
|
|
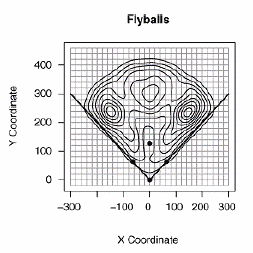
Reprinted from The Fielding Bible Volume III (2012) Baseball Info Solutions Data Collection Bill James, John Dewan and Steve Moyer have been collecting baseball data together for many years. At STATS Inc. they sent scorers to each major league stadium to sit in the press box and record information about each play. Scorers recorded trajectory information for each ball in play as well as the zone to which the ball was hit. When forming Baseball Info Solutions (BIS) in 2002, they decided to start recording a litany of information from video. In addition to pitch type, velocity and location data, they began recording each batted ball location as a pixel on a computer screen rather than a zone. Using recorded video gave their video scouts the ability to rewind as many times as necessary to record accurate information. In the BIS Database, we record the pixel coordinate of each recorded batted ball location. We also translate these (x,y) coordinates into a Vector and Distance which are more intuitive for certain types of analysis. The vector and distance coordinates reflect a polar coordinate system. Vector refers to the degree-wide angle of the recorded location with 135 representing the first base line, 180 as straight-away center field, and 225 as the third base line. Distance refers to the distance from home plate, rounded to the nearest foot. In the early years of BIS, each batted ball was classified by velocity (soft, medium, hard) and type (groundball, line drive, flyball or bunt). Combining this information with hit locations, John Dewan and cohorts developed the original Plus/Minus System for evaluating defenders. In 2006, the company added a more detailed description of the trajectory of each batted ball for clients. We added a new trajectory, fliner to describe the balls higher than a typical line drive but lower than an average fly ball. BIS decided to split line drives and flyballs into four distinct categories: line drives, fliner-liner, fliner-fly, and flyballs. In the Plus/Minus system, the two categories of fliners were grouped together. Around that time, Bill James developed a new system for tracking previously unrecorded details about defensive play. We now know this information as Good Fielding Plays and Defensive Misplays. BIS has been able to record this information back to 2004, marking every ball scooped out of the dirt and every missed cutoff man, among other things. The following year, Baseball Info Solutions began tracking balls hit off outfield walls. No longer would left fielders be penalized for flyballs that hit 20 feet up the Green Monster. In 2010, BIS began tracking the location of the catchers target before every pitch. After completing The Fielding Bible Volume II, BIS decided to record even more information about every ball in play. Now, BIS video scouts put a stopwatch to every batted ball, giving us a more objective description of the balls speed and trajectory. Groundballs are timed from contact with the bat until they are touched by the fielder or cross into the outfield grass, whichever comes first. Flyballs and line drives are timed until they are caught or land untouched. While expanding the variety of data collected in an effort to satisfy the desire for more data, the company has also increased its expectations of data quality. In addition to automated quality control checks and auditing reports, BIS video scouts now complete a minimum of three passes through each major league game. Criticisms of BIS Hit Location Data Michael Humphreys, author of the book Wizardry: Baseballs All-Time Greatest Fielders Revealed wrote an article for The Hardball Times Baseball Annual 2012 in which he spilled out the basics of his system for evaluating every fielder in baseball. His Defensive Regression Analysis (DRA) system utilizes only publicly available data, with the intention of allowing motivated readers to do the math for themselves. He also elects to ignore any form of hit location data because he doesnt trust its accuracy. He elaborates later on in the article citing claims that any manually collected hit location data has biases that render the data, and all analysis based on the data, inaccurate. In Humphreys own words: It appears that stringers coding location data regardless of who they work for, may be anchoring their estimates by reference to the position of the fielder. One possible indirect result of this anchoring effect is that if a fielder catches the ball, the coders may tend to locate the ball close to the fielders position, while if the fielder does not catch the ball, the coder will tend to code the ball as having been farther away. If you think about it a little bit, that would mean that a rangy fielders great plays would tend to be coded as close to his positions and a non-rangy fielders hits allowed would tend to be coded as having been difficult to reach. Any such range bias as [Baseball Prospectus analyst] Colin Wyers has called it, would systematically pull defensive runs estimates toward the mean. To clarify, neither Humphreys nor anyone else would claim that BIS or any other company is marking bad locations intentionally. They claim the alleged bias is subconscious and that the video scouts wouldnt even realize theyre doing it. If a scorer wasnt being careful enough, they might see a flyball to the leftfielder handled routinely and mark it a few feet closer to the regular left field position. For each play, a few feet may not seem like much- However a few feet on tens of thousands of fly balls can add up pretty quickly. Without having actual BIS hit location data, these claims are based on snapshots seen from various clients. Shane Jensen, a professor at Wharton and the University of Pennsylvania, purchased 2002-05 play-by-play data with hit locations from BIS to develop his own fielding analysis, named Spatial Aggregate Fielding Evaluation (SAFE). In a 2009 paper, Jensen laid out the details of SAFE, including an overview of Baseball Info Solutions data. He included a couple of graphs to illustrate the plotted hit locations. The graph below is a contout plot, with the circles surrounding each of the outfield positions representing the higher number of hit locations plotted in these regions.
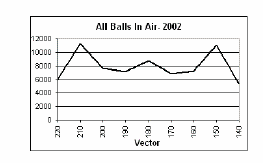
The graph (using 2002-05 BIS data) indicates that, for whatever reason, more hit locations were plotted directly at each outfield position than were plotted in the gaps. Investigation Using the BIS database, we prepared graphs of outfield flyballs by vector, looking at the distribution year by year. In the following graphs, Vector 225 represents the left field foul line. Vector 180 is straight-away center field and Vector 135 is the right field line. We have combined groups of 10 vectors together to smooth out much of the noise.
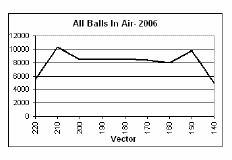
In this graph from 2002, we see clear peaks in line with each outfield position. The first peak, around vector 210, is roughly the angle the left fielder typically occupies before each pitch. The graph indicates that we marked nearly 12,000 flyballs around vector 210, compared to under 8,000 about 10 degrees into the gap in left center. The center fielder lines up near straight-away center of course, and we see a smaller peak of nearly 9,000 fly balls there. And in right field, the graph shows another large peak of 11,000 flyballs at vector 150 compared to the 7,500 and 5,000 on either side. Fast-forward to 2006, where the same chart features far smaller peaks and valleys.
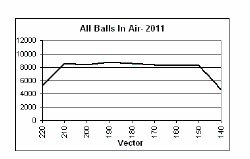
Now lets look at the most recent season of data (2011).
By 2011, the peaks and valleys had smoothed out entirely. Every group of vectors (except down the foul lines) contains between 8,000 and 9,000 flyballs. We also looked at groundball distributions season by season and saw a similar effect. As with flyballs, the peaks and valleys smoothed out in the most recent seasons of data. No Video Plays One important observation relates to the nature of the BIS data collection process. When BIS started collecting data in 2002, video feeds were not the quality, high-definition feeds were accustomed to today. Certain teams, most notably the Montreal Expos, did not televise their full schedule of games, leaving us to rely on their opponents television broadcasts. If neither team televised the game, our scorers would resort to radio broadcasts to log the play-by-play. We were up-front with our clients explaining the limitations of our data in those early years. From our clients perspective, any hit location was better than no hit location; therefore we plotted the hit locations based on the descriptions available to use, even if that was just a radio broadcast. If there was a flyout to the left fielder, wed mark it somewhere near where the left fielder usually stands. Knowing a ball was hit to left field is better than not knowing anything at all about its location. There are also games where television feeds exist, but for whatever reason they miss a few pitches. They occasionally have technical problems or they come back from a commercial break late. If we have an alternate video feed of the game, we can switch for any plays we missed. However, especially for the earlier years, an alternate feed was not always available. These issues have been less and less prevalent in recent years. In 2002, we marked about 8 percent of batted balls as no video plays. That figure had dropped to 2 percent by 2006, under 1 percent by 2008, and essentially 0 percent in 2011. The Expos moved to Washington, solidified their financial standing, and secured a long-term television contract. Other teams also expanded their television coverage to include more games, especially on the road. In recent seasons, almost all games have more than one video broadcast available. In those early seasons, we did make a note when video footage of a play was unavailable. For the most precise analysis, it might be useful to remove those plays from consideration. For example, our Plus/Minus System specifically excludes No Video plays before 2006. Were evaluating a slightly smaller sample of plays, but were removing that potential bias from our numbers. Additional Quality Control BIS has gone to great lengths to improve data quality. Over the years weve:
Considering all of these improvements and more over the past decade, its no surprise that our data quality has improved to its current level. Conclusions The concerns raised by Michael Humphreys and others may have some validity, especially when using data from earlier years with estimated hit locations. However, as technology and video feeds have improved, so has our data quality. By no means do we believe that our most recent data is perfect. Its possible, even likely, that there are other forms of bias or error that we havent even considered yet. Fortunately, weve also begun to collect more objective data such as the batted ball timer, to reduce the room for error. Stronger data collection will ultimately produce better analysis and improve our understanding and appreciation for Major League Baseball. |
|
 | |